Home › Mississippi › Hunting seasons › CWD results by county
Season tool
Mississippi CWD Results by County, All 82 Counties
Samples tested and CWD positives for every Mississippi county from the MDWFP county layer, with zone membership and the feeding ban.
Photo: David Williss (CC BY 2.0)
CWD sample results for every Mississippi county
The MDWFP county layer lists samples tested and positives for all 82 counties: 67,712 samples and 586 positives in total. 18 counties have at least one positive and 64 have none. Panola County has the most samples, 3,389. The MDWFP county layer prints no season or date for these counts, so they are cumulative totals as served on the day we read them.
From MDWFP County_Info layer (MDWFP); no date is printed on the counts, checked November 14, 2026.
Look up your county
| County | Samples tested | Positives | Share positive | CWD zone | Feeding ban |
|---|---|---|---|---|---|
| Adams | 939 | 0 | 0.0% | Outside zones | No |
| Alcorn | 2,552 | 22 | 0.9% | Whole county | Yes |
| Amite | 880 | 0 | 0.0% | Outside zones | No |
| Attala | 1,031 | 0 | 0.0% | Outside zones | No |
| Benton | 2,299 | 300 | 13.0% | Whole county | Yes |
| Bolivar | 648 | 0 | 0.0% | Outside zones | No |
| Calhoun | 368 | 0 | 0.0% | Outside zones | No |
| Carroll | 615 | 0 | 0.0% | Outside zones | No |
| Chickasaw | 393 | 0 | 0.0% | Outside zones | No |
| Choctaw | 363 | 0 | 0.0% | Outside zones | No |
| Claiborne | 1,472 | 6 | 0.4% | Whole county | Yes |
| Clarke | 465 | 0 | 0.0% | Outside zones | No |
| Clay | 202 | 0 | 0.0% | Outside zones | No |
| Coahoma | 442 | 0 | 0.0% | Part of county | Yes |
| Copiah | 1,621 | 0 | 0.0% | Outside zones | No |
| Covington | 177 | 0 | 0.0% | Outside zones | No |
| DeSoto | 947 | 4 | 0.4% | Whole county | Yes |
| Forrest | 747 | 0 | 0.0% | Outside zones | No |
| Franklin | 691 | 0 | 0.0% | Outside zones | No |
| George | 114 | 0 | 0.0% | Outside zones | No |
| Greene | 254 | 0 | 0.0% | Outside zones | No |
| Grenada | 1,093 | 0 | 0.0% | Outside zones | No |
| Hancock | 423 | 0 | 0.0% | Part of county | Yes |
| Harrison | 233 | 1 | 0.4% | Part of county | Yes |
| Hinds | 2,141 | 0 | 0.0% | Outside zones | No |
| Holmes | 684 | 0 | 0.0% | Outside zones | No |
| Humphreys | 363 | 0 | 0.0% | Outside zones | No |
| Issaquena | 1,220 | 3 | 0.2% | Part of county | Yes |
| Itawamba | 2,277 | 0 | 0.0% | Outside zones | No |
| Jackson | 144 | 0 | 0.0% | Outside zones | No |
| Jasper | 612 | 0 | 0.0% | Outside zones | No |
| Jefferson | 883 | 0 | 0.0% | Outside zones | No |
| Jefferson Davis | 163 | 0 | 0.0% | Outside zones | No |
| Jones | 364 | 0 | 0.0% | Outside zones | No |
| Kemper | 505 | 0 | 0.0% | Outside zones | No |
| Lafayette | 1,326 | 3 | 0.2% | Whole county | Yes |
| Lamar | 513 | 0 | 0.0% | Outside zones | No |
| Lauderdale | 807 | 0 | 0.0% | Outside zones | No |
| Lawrence | 244 | 0 | 0.0% | Outside zones | No |
| Leake | 311 | 0 | 0.0% | Outside zones | No |
| Lee | 522 | 0 | 0.0% | Outside zones | No |
| Leflore | 646 | 0 | 0.0% | Outside zones | No |
| Lincoln | 1,040 | 0 | 0.0% | Outside zones | No |
| Lowndes | 405 | 0 | 0.0% | Outside zones | No |
| Madison | 1,656 | 0 | 0.0% | Outside zones | No |
| Marion | 347 | 0 | 0.0% | Outside zones | No |
| Marshall | 3,106 | 192 | 6.2% | Whole county | Yes |
| Monroe | 593 | 0 | 0.0% | Outside zones | No |
| Montgomery | 488 | 0 | 0.0% | Outside zones | No |
| Neshoba | 394 | 0 | 0.0% | Outside zones | No |
| Newton | 853 | 0 | 0.0% | Outside zones | No |
| Noxubee | 829 | 0 | 0.0% | Outside zones | No |
| Oktibbeha | 643 | 0 | 0.0% | Outside zones | No |
| Panola | 3,389 | 3 | 0.1% | Whole county | Yes |
| Pearl River | 657 | 0 | 0.0% | Outside zones | No |
| Perry | 246 | 0 | 0.0% | Outside zones | No |
| Pike | 150 | 0 | 0.0% | Outside zones | No |
| Pontotoc | 1,293 | 3 | 0.2% | Part of county | Yes |
| Prentiss | 282 | 1 | 0.4% | Whole county | Yes |
| Quitman | 856 | 0 | 0.0% | Part of county | Yes |
| Rankin | 1,126 | 0 | 0.0% | Outside zones | No |
| Scott | 506 | 0 | 0.0% | Outside zones | No |
| Sharkey | 212 | 0 | 0.0% | Outside zones | No |
| Simpson | 510 | 0 | 0.0% | Outside zones | No |
| Smith | 319 | 0 | 0.0% | Outside zones | No |
| Stone | 316 | 0 | 0.0% | Outside zones | No |
| Sunflower | 171 | 0 | 0.0% | Outside zones | No |
| Tallahatchie | 1,160 | 1 | 0.1% | Outside zones | No |
| Tate | 988 | 10 | 1.0% | Whole county | Yes |
| Tippah | 1,428 | 17 | 1.2% | Whole county | Yes |
| Tishomingo | 1,788 | 7 | 0.4% | Whole county | Yes |
| Tunica | 249 | 1 | 0.4% | Part of county | Yes |
| Union | 1,220 | 2 | 0.2% | Whole county | Yes |
| Walthall | 110 | 0 | 0.0% | Outside zones | No |
| Warren | 2,704 | 10 | 0.4% | Whole county | Yes |
| Washington | 295 | 0 | 0.0% | Outside zones | No |
| Wayne | 126 | 0 | 0.0% | Outside zones | No |
| Webster | 409 | 0 | 0.0% | Outside zones | No |
| Wilkinson | 1,245 | 0 | 0.0% | Outside zones | No |
| Winston | 373 | 0 | 0.0% | Outside zones | No |
| Yalobusha | 907 | 0 | 0.0% | Outside zones | No |
| Yazoo | 1,629 | 0 | 0.0% | Outside zones | No |
From MDWFP County_Info layer (MDWFP), checked November 14, 2026.
Zoned counties with no positives
Zone membership and positives do not match one for one: Coahoma, Hancock and Quitman are in a zone with zero positives listed.
From MDWFP CWD zones page and county layer (MDWFP), checked November 14, 2026.
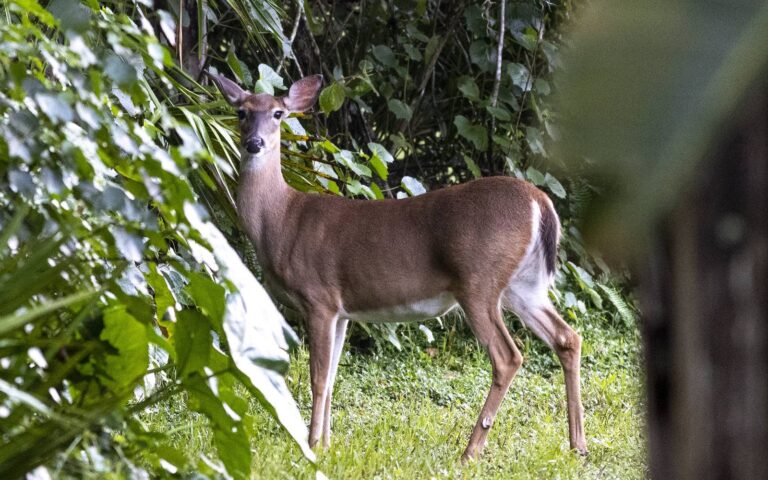
Whitetail doe standing at the edge of a green clearingPhoto: Gary Leavens (CC BY-SA 2.0)

White-tailed buck walking through hardwood leaf litterPhoto: U.S. Fish and Wildlife Service Midwest Region (Public Domain Mark 1.0)

Spotted whitetail fawn beside its motherPhoto: Patti Petersen (Public Domain Mark 1.0)
CWD results by county FAQ
Which counties have positive deer?
Alcorn, Benton, Claiborne, DeSoto, Harrison, Issaquena, Lafayette, Marshall, Panola, Pontotoc, Prentiss, Tallahatchie, Tate, Tippah, Tishomingo, Tunica, Union and Warren.
What county has the highest count?
Benton County has 300 positives out of 2,299 samples, then Marshall with 192.
Which county tests the most?
Panola County, with 3,389 samples tested.
Which counties show none?
64 of 82 counties list zero positives.
Are these counts current?
The MDWFP county layer prints no season or date for these counts, so they are cumulative totals as served on the day we read them.
What do the percentages mean?
Positives divided by samples tested for the county, so it is a share of tested deer, not of all deer.
Is feeding banned outside zones?
The ban applies inside every CWD management zone; 20 counties carry the flag in the layer. Outside the zones, feeders are legal on private land with the 100-yard property line rule.
Does the table cover harvest?
MDWFP does not publish deer or turkey harvest totals by county on the pages and PDFs we read, so none are shown here.
How do I read the zone lines?
The MDWFP zone map PDF shows them; see the CWD zones page for the boundary text.
Other photos on this page: Gary Leavens (CC BY-SA 2.0); U.S. Fish and Wildlife Service Midwest Region (Public Domain Mark 1.0); Patti Petersen (Public Domain Mark 1.0).